| ||||||||||||||||||||||||||
| ||||||||||||||||||||||||||
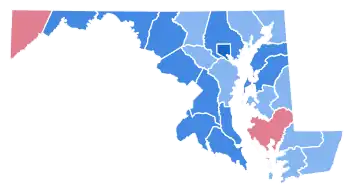 County Results
| ||||||||||||||||||||||||||
| ||||||||||||||||||||||||||
.jpg.webp)
.jpg.webp)
| Elections in Maryland |
|---|
.svg.png.webp) |
|
|
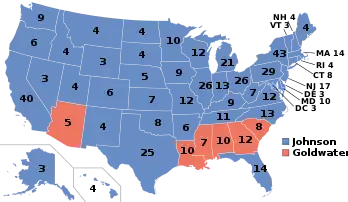
The 1964 United States presidential election in Maryland took place on November 3, 1964, as part of the 1964 United States presidential election. State voters chose 10[1] representatives, or electors, to the Electoral College, who voted for president and vice president.
Campaign
George Wallace ran in the Democratic primary, but was defeated by U.S. Senator Daniel Brewster, who served as a surrogate for Johnson. Wallace won a majority of the white vote.[2]
As of the 2020 presidential election, this is the last election in which Harford County, Carroll County, Washington County, Wicomico County, Worcester County, Queen Anne's County and Caroline County voted for a Democratic Presidential candidate.[3]
Anne Arundel County would not vote Democratic again until 2016, while Frederick and Talbot counties would not do so until 2020, with Donald Trump being the first Republican to lose all three of these counties, as well as the statewide white vote, since this election.[3]
Results
| 1964 United States presidential election in Maryland[4] | ||||||
|---|---|---|---|---|---|---|
| Party | Candidate | Running mate | Votes | Percentage | Electoral votes | |
| Democratic | Lyndon B. Johnson | Hubert Humphrey | 730,912 | 65.47% | 10 | |
| Republican | Barry Goldwater | William E. Miller | 385,495 | 34.53% | 0 | |
Results by county
| County | Lyndon Baines Johnson Democratic |
Barry Morris Goldwater Republican |
Margin | Total votes cast[5] | |||
|---|---|---|---|---|---|---|---|
| # | % | # | % | # | % | ||
| Allegany | 20,425 | 62.25% | 12,384 | 37.75% | 8,041 | 24.51% | 32,809 |
| Anne Arundel | 37,981 | 58.70% | 26,725 | 41.30% | 11,256 | 17.40% | 64,706 |
| Baltimore | 117,153 | 60.07% | 77,870 | 39.93% | 39,283 | 20.14% | 195,023 |
| Baltimore City | 240,716 | 75.98% | 76,089 | 24.02% | 164,627 | 51.96% | 316,805 |
| Calvert | 3,335 | 65.39% | 1,765 | 34.61% | 1,570 | 30.78% | 5,100 |
| Caroline | 3,710 | 57.91% | 2,696 | 42.09% | 1,014 | 15.83% | 6,406 |
| Carroll | 8,451 | 50.35% | 8,332 | 49.65% | 119 | 0.71% | 16,783 |
| Cecil | 7,854 | 59.57% | 5,330 | 40.43% | 2,524 | 19.14% | 13,184 |
| Charles | 6,546 | 65.45% | 3,455 | 34.55% | 3,091 | 30.91% | 10,001 |
| Dorchester | 4,564 | 46.14% | 5,327 | 53.86% | -763 | -7.71% | 9,891 |
| Frederick | 14,548 | 61.10% | 9,264 | 38.90% | 5,284 | 22.19% | 23,812 |
| Garrett | 3,515 | 49.24% | 3,624 | 50.76% | -109 | -1.53% | 7,139 |
| Harford | 13,550 | 57.62% | 9,968 | 42.38% | 3,582 | 15.23% | 23,518 |
| Howard | 8,185 | 54.50% | 6,833 | 45.50% | 1,352 | 9.00% | 15,018 |
| Kent | 4,113 | 67.19% | 2,008 | 32.81% | 2,105 | 34.39% | 6,121 |
| Montgomery | 103,113 | 66.24% | 52,554 | 33.76% | 50,559 | 32.48% | 155,667 |
| Prince George's | 81,806 | 63.80% | 46,413 | 36.20% | 35,393 | 27.60% | 128,219 |
| Queen Anne's | 4,052 | 67.45% | 1,955 | 32.55% | 2,097 | 34.91% | 6,007 |
| Somerset | 4,527 | 58.93% | 3,155 | 41.07% | 1,372 | 17.86% | 7,682 |
| St. Mary's | 5,831 | 66.95% | 2,878 | 33.05% | 2,953 | 33.91% | 8,709 |
| Talbot | 4,671 | 55.85% | 3,693 | 44.15% | 978 | 11.69% | 8,364 |
| Washington | 19,858 | 60.89% | 12,756 | 39.11% | 7,102 | 21.78% | 32,614 |
| Wicomico | 8,695 | 53.86% | 7,448 | 46.14% | 1,247 | 7.72% | 16,143 |
| Worcester | 3,713 | 55.53% | 2,973 | 44.47% | 740 | 11.07% | 6,686 |
| Totals | 730,912 | 65.47% | 385,495 | 34.53% | 345,417 | 30.94% | 1,116,407 |
References
- ↑ "1964 Election for the Forty-Fifth Term (1965-69)". Retrieved May 30, 2017.
- ↑ Black & Black 1992, p. 160-161.
- 1 2 Sullivan, Robert David; ‘How the Red and Blue Map Evolved Over the Past Century’; America Magazine in The National Catholic Review; June 29, 2016
- ↑ Maryland Manual 1965–1966. The Hall of Records Commission of the State of Maryland. p. 477. Retrieved May 12, 2019.
- ↑ Scammon, Richard M. (compiler); America at the Polls: A Handbook of Presidential Election Statistics 1920-1964; p. 211 ISBN 0405077114
Works cited
- Black, Earl; Black, Merle (1992). The Vital South: How Presidents Are Elected. Harvard University Press. ISBN 0674941306.