| ||||||||||||||||||||||||||
| ||||||||||||||||||||||||||
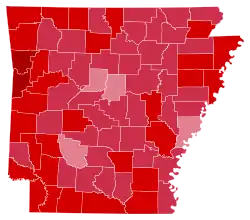 County Results
Nixon 50-60% 60-70% 70-80% 80-90%
| ||||||||||||||||||||||||||
| ||||||||||||||||||||||||||
.jpg.webp)
_(3x4-1).jpg.webp)
| Elections in Arkansas |
|---|
 |
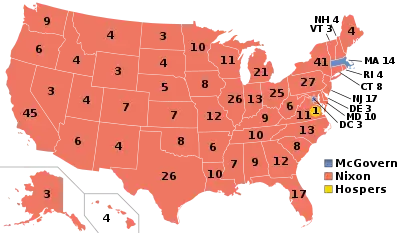
The 1972 United States presidential election in Arkansas took place on November 7, 1972, as part of the 1972 United States presidential election. State voters chose six[2] representatives, or electors, to the Electoral College, who voted for president and vice president.
Arkansas was won by incumbent President Richard Nixon (R–California), with 68.82% of the popular vote, against George McGovern (D–South Dakota), with 30.71% of the popular vote.[3][4] John G. Schmitz was the only other candidate on the ballot, and, as the candidate for the American Independent Party, he received just over three thousand votes.
This is the last presidential election in which the Republican carried Phillips County, Jefferson County, Lee County, Chicot County, and Desha County in a presidential election. Jackson, Lincoln, and Clark counties would not vote Republican again until 2008, and Woodruff County until 2016.[5]
80% of white voters supported Nixon while 19% supported McGovern.[6][7]
Nixon was the first Republican presidential candidate to win the counties of Arkansas, Ashley, Columbia, Drew, Howard and Union since Barry Goldwater in 1964, Craighead, Crawford, Montgomery, Pike, Randolph, Scott and Sharp since his own run in 1960, Crittenden and Pulaski since Dwight D. Eisenhower in 1956, Hot Spring County since Herbert Hoover in 1928, Lincoln, Monroe and Nevada since Warren G. Harding in 1920, Chicot, Mississippi, Ouachita and St. Francis since William Howard Taft in 1908, Clark, Hempstead and Prairie since Theodore Roosevelt in 1904, Jefferson and Lafayette since William McKinley in 1900, Desha, Lee, Little River and Phillips since Benjamin Harrison in 1888, Conway and Woodruff since James A. Garfield in 1880, Franklin, Jackson and Perry since Ulysses S. Grant in 1872, and Yell County since Grant in 1868. He was the first ever to win the counties of Calhoun, Cross, Lawrence, Poinsett and White.
Results
| Party | Candidate | Votes | % | |
|---|---|---|---|---|
| Republican | Richard Nixon (inc.) | 445,751 | 68.82% | |
| Democratic | George McGovern | 198,899 | 30.71% | |
| American Independent | John G. Schmitz | 3,016 | 0.47% | |
| Total votes | 647,666 | 100% | ||
Results by county
| County | Richard Milhous Nixon Republican |
George Stanley McGovern Democratic |
John George Schmitz American Independent |
Margin | Totals votes cast | ||||
|---|---|---|---|---|---|---|---|---|---|
| # | % | # | % | # | % | # | % | ||
| Arkansas | 5,225 | 73.46% | 1,849 | 25.99% | 39 | 0.55% | 3,376 | 47.46% | 7,113 |
| Ashley | 5,506 | 76.44% | 1,680 | 23.32% | 17 | 0.24% | 3,826 | 53.12% | 7,203 |
| Baxter | 6,754 | 70.65% | 2,677 | 28.00% | 129 | 1.35% | 4,077 | 42.65% | 9,560 |
| Benton | 14,621 | 77.86% | 4,083 | 21.74% | 74 | 0.39% | 10,538 | 56.12% | 18,778 |
| Boone | 5,484 | 74.49% | 1,862 | 25.29% | 16 | 0.22% | 3,622 | 49.20% | 7,362 |
| Bradley | 3,218 | 69.74% | 1,368 | 29.65% | 28 | 0.61% | 1,850 | 40.10% | 4,614 |
| Calhoun | 1,298 | 64.26% | 707 | 35.00% | 15 | 0.74% | 591 | 29.26% | 2,020 |
| Carroll | 3,565 | 70.09% | 1,401 | 27.55% | 120 | 2.36% | 2,164 | 42.55% | 5,086 |
| Chicot | 2,858 | 65.96% | 1,469 | 33.90% | 6 | 0.14% | 1,389 | 32.06% | 4,333 |
| Clark | 4,173 | 59.96% | 2,741 | 39.38% | 46 | 0.66% | 1,432 | 20.57% | 6,960 |
| Clay | 4,381 | 69.39% | 1,933 | 30.61% | 0 | 0.00% | 2,448 | 38.77% | 6,314 |
| Cleburne | 2,870 | 67.15% | 1,400 | 32.76% | 4 | 0.09% | 1,470 | 34.39% | 4,274 |
| Cleveland | 1,837 | 71.45% | 734 | 28.55% | 0 | 0.00% | 1,103 | 42.90% | 2,571 |
| Columbia | 5,801 | 72.30% | 2,193 | 27.33% | 29 | 0.36% | 3,608 | 44.97% | 8,023 |
| Conway | 4,187 | 58.11% | 3,009 | 41.76% | 9 | 0.12% | 1,178 | 16.35% | 7,205 |
| Craighead | 11,312 | 65.94% | 5,843 | 34.06% | 0 | 0.00% | 5,469 | 31.88% | 17,155 |
| Crawford | 6,974 | 81.41% | 1,520 | 17.74% | 72 | 0.84% | 5,454 | 63.67% | 8,566 |
| Crittenden | 7,971 | 71.06% | 3,246 | 28.94% | 0 | 0.00% | 4,725 | 42.12% | 11,217 |
| Cross | 3,743 | 72.78% | 1,221 | 23.74% | 179 | 3.48% | 2,522 | 49.04% | 5,143 |
| Dallas | 2,152 | 60.55% | 1,402 | 39.45% | 0 | 0.00% | 750 | 21.10% | 3,554 |
| Desha | 3,385 | 66.92% | 1,665 | 32.92% | 8 | 0.16% | 1,720 | 34.01% | 5,058 |
| Drew | 3,334 | 74.06% | 1,168 | 25.94% | 0 | 0.00% | 2,166 | 48.11% | 4,502 |
| Faulkner | 6,746 | 59.44% | 4,604 | 40.56% | 0 | 0.00% | 2,142 | 18.87% | 11,350 |
| Franklin | 3,678 | 74.60% | 1,252 | 25.40% | 0 | 0.00% | 2,426 | 49.21% | 4,930 |
| Fulton | 2,030 | 67.89% | 960 | 32.11% | 0 | 0.00% | 1,070 | 35.79% | 2,990 |
| Garland | 15,602 | 73.90% | 5,207 | 24.66% | 303 | 1.44% | 10,395 | 49.24% | 21,112 |
| Grant | 2,414 | 67.41% | 1,147 | 32.03% | 20 | 0.56% | 1,267 | 35.38% | 3,581 |
| Greene | 6,128 | 73.03% | 2,263 | 26.97% | 0 | 0.00% | 3,865 | 46.06% | 8,391 |
| Hempstead | 4,963 | 70.80% | 2,047 | 29.20% | 0 | 0.00% | 2,916 | 41.60% | 7,010 |
| Hot Spring | 5,378 | 64.54% | 2,872 | 34.47% | 83 | 1.00% | 2,506 | 30.07% | 8,333 |
| Howard | 2,682 | 71.50% | 1,069 | 28.50% | 0 | 0.00% | 1,613 | 43.00% | 3,751 |
| Independence | 5,076 | 65.74% | 2,630 | 34.06% | 15 | 0.19% | 2,446 | 31.68% | 7,721 |
| Izard | 2,001 | 64.26% | 1,108 | 35.58% | 5 | 0.16% | 893 | 28.68% | 3,114 |
| Jackson | 4,196 | 66.73% | 2,092 | 33.27% | 0 | 0.00% | 2,104 | 33.46% | 6,288 |
| Jefferson | 16,888 | 61.95% | 10,346 | 37.95% | 26 | 0.10% | 6,542 | 24.00% | 27,260 |
| Johnson | 4,107 | 66.76% | 2,045 | 33.24% | 0 | 0.00% | 2,062 | 33.52% | 6,152 |
| Lafayette | 2,460 | 71.91% | 952 | 27.83% | 9 | 0.26% | 1,508 | 44.08% | 3,421 |
| Lawrence | 3,981 | 69.45% | 1,751 | 30.55% | 0 | 0.00% | 2,230 | 38.90% | 5,732 |
| Lee | 3,540 | 64.59% | 1,907 | 34.79% | 34 | 0.62% | 1,633 | 29.79% | 5,481 |
| Lincoln | 2,318 | 67.52% | 1,115 | 32.48% | 0 | 0.00% | 1,203 | 35.04% | 3,433 |
| Little River | 2,550 | 70.04% | 1,091 | 29.96% | 0 | 0.00% | 1,459 | 40.07% | 3,641 |
| Logan | 4,964 | 71.42% | 1,956 | 28.14% | 30 | 0.43% | 3,008 | 43.28% | 6,950 |
| Lonoke | 5,298 | 67.62% | 2,504 | 31.96% | 33 | 0.42% | 2,794 | 35.66% | 7,835 |
| Madison | 3,372 | 64.09% | 1,889 | 35.91% | 0 | 0.00% | 1,483 | 28.19% | 5,261 |
| Marion | 2,331 | 66.66% | 1,108 | 31.68% | 58 | 1.66% | 1,223 | 34.97% | 3,497 |
| Miller | 8,355 | 74.53% | 2,855 | 25.47% | 0 | 0.00% | 5,500 | 49.06% | 11,210 |
| Mississippi | 10,931 | 74.73% | 3,544 | 24.23% | 152 | 1.04% | 7,387 | 50.50% | 14,627 |
| Monroe | 2,897 | 63.45% | 1,578 | 34.56% | 91 | 1.99% | 1,319 | 28.89% | 4,566 |
| Montgomery | 1,555 | 68.17% | 688 | 30.16% | 38 | 1.67% | 867 | 38.01% | 2,281 |
| Nevada | 2,513 | 68.07% | 1,179 | 31.93% | 0 | 0.00% | 1,334 | 36.13% | 3,692 |
| Newton | 1,924 | 69.84% | 831 | 30.16% | 0 | 0.00% | 1,093 | 39.67% | 2,755 |
| Ouachita | 6,620 | 62.68% | 3,931 | 37.22% | 11 | 0.10% | 2,689 | 25.46% | 10,562 |
| Perry | 1,445 | 63.88% | 810 | 35.81% | 7 | 0.31% | 635 | 28.07% | 2,262 |
| Phillips | 6,235 | 58.90% | 4,283 | 40.46% | 68 | 0.64% | 1,952 | 18.44% | 10,586 |
| Pike | 2,316 | 73.69% | 798 | 25.39% | 29 | 0.92% | 1,518 | 48.30% | 3,143 |
| Poinsett | 7,010 | 77.91% | 1,908 | 21.20% | 80 | 0.89% | 5,102 | 56.70% | 8,998 |
| Polk | 3,609 | 74.83% | 1,120 | 23.22% | 94 | 1.95% | 2,489 | 51.61% | 4,823 |
| Pope | 6,917 | 67.52% | 3,302 | 32.23% | 25 | 0.24% | 3,615 | 35.29% | 10,244 |
| Prairie | 2,186 | 71.46% | 873 | 28.54% | 0 | 0.00% | 1,313 | 42.92% | 3,059 |
| Pulaski | 57,576 | 62.95% | 33,611 | 36.75% | 281 | 0.31% | 23,965 | 26.20% | 91,468 |
| Randolph | 2,578 | 62.83% | 1,525 | 37.17% | 0 | 0.00% | 1,053 | 25.66% | 4,103 |
| St. Francis | 5,692 | 65.95% | 2,674 | 30.98% | 265 | 3.07% | 3,018 | 34.97% | 8,631 |
| Saline | 7,972 | 63.64% | 4,503 | 35.95% | 52 | 0.42% | 3,469 | 27.69% | 12,527 |
| Scott | 2,424 | 75.87% | 771 | 24.13% | 0 | 0.00% | 1,653 | 51.74% | 3,195 |
| Searcy | 3,163 | 78.76% | 853 | 21.24% | 0 | 0.00% | 2,310 | 57.52% | 4,016 |
| Sebastian | 25,219 | 81.23% | 5,770 | 18.58% | 58 | 0.19% | 19,449 | 62.64% | 31,047 |
| Sevier | 2,526 | 69.91% | 1,048 | 29.01% | 39 | 1.08% | 1,478 | 40.91% | 3,613 |
| Sharp | 2,677 | 69.71% | 1,154 | 30.05% | 9 | 0.23% | 1,523 | 39.66% | 3,840 |
| Stone | 1,989 | 67.38% | 958 | 32.45% | 5 | 0.17% | 1,031 | 34.93% | 2,952 |
| Union | 11,925 | 76.72% | 3,531 | 22.72% | 87 | 0.56% | 8,394 | 54.01% | 15,543 |
| Van Buren | 2,622 | 61.91% | 1,594 | 37.64% | 19 | 0.45% | 1,028 | 24.27% | 4,235 |
| Washington | 17,523 | 70.94% | 7,108 | 28.78% | 70 | 0.28% | 10,415 | 42.16% | 24,701 |
| White | 8,701 | 67.24% | 4,161 | 32.15% | 79 | 0.61% | 4,540 | 35.08% | 12,941 |
| Woodruff | 1,989 | 61.73% | 1,183 | 36.72% | 50 | 1.55% | 806 | 25.02% | 3,222 |
| Yell | 3,310 | 66.48% | 1,669 | 33.52% | 0 | 0.00% | 1,641 | 32.96% | 4,979 |
| Totals | 445,751 | 68.82% | 198,899 | 30.71% | 3,016 | 0.47% | 246,852 | 38.11% | 647,666 |
See also
References
- ↑ "United States Presidential election of 1972 - Encyclopædia Britannica". Retrieved January 7, 2017.
- ↑ "1972 Election for the Forty-Seventh Term (1973-77)". Retrieved January 7, 2017.
- ↑ "1972 Presidential General Election Results - Arkansas". Retrieved January 7, 2017.
- ↑ "The American Presidency Project - Election of 1972". Retrieved January 7, 2017.
- ↑ Sullivan, Robert David; ‘How the Red and Blue Map Evolved Over the Past Century’; America Magazine in The National Catholic Review; June 29, 2016
- ↑ Black & Black 1992, p. 295.
- ↑ Black & Black 1992, p. 335.
Works cited
- Black, Earl; Black, Merle (1992). The Vital South: How Presidents Are Elected. Harvard University Press. ISBN 0674941306.