| ||||||||||||||||||||||||||
| ||||||||||||||||||||||||||
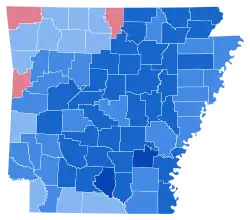 County Results
| ||||||||||||||||||||||||||
| ||||||||||||||||||||||||||

.jpg.webp)
| Elections in Arkansas |
|---|
 |
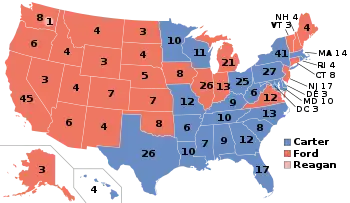
The 1976 United States presidential election in Arkansas took place on November 2, 1976, as part of the wider 1976 United States presidential election. State voters chose six electors to represent them in the Electoral College.
Arkansas overwhelmingly voted for the Democratic Party, former governor of Georgia Jimmy Carter and his running mate Minnesota U.S. Senator Walter Mondale with 64.94% of the vote. The Carter/Mondale ticket defeated Republican incumbent president Gerald Ford of Michigan and his running mate Kansas U.S. Senator Bob Dole in the state by a margin of 30.01%. Arkansas weighed in as nearly thirty percent more Democratic than the national average.[1]
Campaign
58% of white voters supported Carter while 42% supported Ford.[2][3]
This is the last election in which Searcy County and Crawford County voted for the Democratic candidate.[4]
Carter was the first Democratic presidential candidate to win the counties of Chicot, Conway, Johnson, Lee, Phillips and Pulaski since Hubert Humphrey in 1968, Boone, Bradley, Calhoun, Clark, Clay, Cleburne, Cleveland, Craighead, Crawford, Crittenden, Cross, Dallas, Desha, Faulkner, Franklin, Fulton, Garland, Grant, Greene, Hempstead, Hot Spring, Independence, Izard, Jackson, Jefferson, Lafayette, Lawrence, Lincoln, Little River, Logan, Lonoke, Madison, Marion, Miller, Mississippi, Monroe, Montgomery, Nevada, Newton, Ouachita, Perry, Pike, Poinsett, Polk, Pope, Prairie, Randolph, Saline, Scott, Sevier, Sharp, St. Francis, Stone, Van Buren, Washington, White, Woodruff and Yell since Lyndon B. Johnson in 1964, Arkansas, Ashley, Columbia, Drew, Howard and Union since John F. Kennedy in 1960, and Carroll and Searcy since Harry S. Truman in 1948.
Results
| 1976 United States presidential election in Arkansas[1] | |||||
|---|---|---|---|---|---|
| Party | Candidate | Votes | Percentage | Electoral votes | |
| Democratic | Jimmy Carter | 499,614 | 64.94% | 6 | |
| Republican | Gerald Ford (incumbent) | 268,753 | 34.93% | 0 | |
| Write-ins | Eugene McCarthy | 647 | 0.08% | 0 | |
| Write-ins | Thomas J. Anderson | 382 | 0.05% | 0 | |
| Totals | 769,396 | 100.00% | 6 | ||
| Voter turnout (Voting age/Registered voters) | 51%/75% | ||||
Results by county
| County | James Earl Carter Democratic |
Gerald Rudolph Ford Republican |
Various candidates Write-ins |
Margin | Total votes cast | ||||
|---|---|---|---|---|---|---|---|---|---|
| # | % | # | % | # | % | # | % | ||
| Arkansas | 5,640 | 69.46% | 2,480 | 30.54% | 3,160 | 38.92% | 8,120 | ||
| Ashley | 5,253 | 62.88% | 3,092 | 37.01% | 9 | 0.11% | 2,161 | 25.87% | 8,354 |
| Baxter | 5,766 | 49.49% | 5,885 | 50.51% | -119 | -1.02% | 11,651 | ||
| Benton | 11,289 | 47.00% | 12,670 | 52.75% | 61 | 0.25% | -1,381 | -5.75% | 24,020 |
| Boone | 5,388 | 57.64% | 3,959 | 42.36% | 1,429 | 15.29% | 9,347 | ||
| Bradley | 3,567 | 75.88% | 1,134 | 24.12% | 2,433 | 51.75% | 4,701 | ||
| Calhoun | 2,014 | 80.11% | 495 | 19.69% | 5 | 0.20% | 1,519 | 60.42% | 2,514 |
| Carroll | 3,791 | 57.01% | 2,804 | 42.17% | 55 | 0.83% | 987 | 14.84% | 6,650 |
| Chicot | 3,868 | 70.39% | 1,621 | 29.50% | 6 | 0.11% | 2,247 | 40.89% | 5,495 |
| Clark | 6,641 | 78.32% | 1,816 | 21.42% | 22 | 0.26% | 4,825 | 56.91% | 8,479 |
| Clay | 5,664 | 74.95% | 1,893 | 25.05% | 3,771 | 49.90% | 7,557 | ||
| Cleburne | 5,726 | 74.07% | 1,992 | 25.77% | 13 | 0.17% | 3,734 | 48.30% | 7,731 |
| Cleveland | 2,320 | 78.22% | 646 | 21.78% | 1,674 | 56.44% | 2,966 | ||
| Columbia | 4,708 | 52.31% | 4,287 | 47.63% | 6 | 0.07% | 421 | 4.68% | 9,001 |
| Conway | 6,443 | 74.67% | 2,177 | 25.23% | 9 | 0.10% | 4,266 | 49.44% | 8,629 |
| Craighead | 13,840 | 69.02% | 6,213 | 30.98% | 7,627 | 38.03% | 20,053 | ||
| Crawford | 5,946 | 55.52% | 4,764 | 44.48% | 1,182 | 11.04% | 10,710 | ||
| Crittenden | 8,249 | 61.26% | 5,202 | 38.63% | 14 | 0.10% | 3,047 | 22.63% | 13,465 |
| Cross | 4,198 | 68.40% | 1,909 | 31.11% | 30 | 0.49% | 2,289 | 37.30% | 6,137 |
| Dallas | 3,266 | 76.20% | 1,012 | 23.61% | 8 | 0.19% | 2,254 | 52.59% | 4,286 |
| Desha | 4,228 | 75.50% | 1,372 | 24.50% | 2,856 | 51.00% | 5,600 | ||
| Drew | 3,750 | 68.43% | 1,730 | 31.57% | 2,020 | 36.86% | 5,480 | ||
| Faulkner | 11,423 | 74.45% | 3,904 | 25.44% | 16 | 0.10% | 7,519 | 49.01% | 15,343 |
| Franklin | 3,703 | 65.24% | 1,973 | 34.76% | 1,730 | 30.48% | 5,676 | ||
| Fulton | 2,670 | 71.87% | 1,038 | 27.94% | 7 | 0.19% | 1,632 | 43.93% | 3,715 |
| Garland | 15,707 | 60.02% | 10,394 | 39.72% | 69 | 0.26% | 5,313 | 20.30% | 26,170 |
| Grant | 3,797 | 78.39% | 1,047 | 21.61% | 2,750 | 56.77% | 4,844 | ||
| Greene | 7,495 | 73.54% | 2,690 | 26.39% | 7 | 0.07% | 4,805 | 47.14% | 10,192 |
| Hempstead | 5,397 | 65.37% | 2,859 | 34.63% | 2,538 | 30.74% | 8,256 | ||
| Hot Spring | 7,809 | 78.12% | 2,187 | 21.88% | 5,622 | 56.24% | 9,996 | ||
| Howard | 3,207 | 67.06% | 1,575 | 32.94% | 1,632 | 34.13% | 4,782 | ||
| Independence | 7,116 | 71.17% | 2,878 | 28.79% | 4 | 0.04% | 4,238 | 42.39% | 9,998 |
| Izard | 3,328 | 70.48% | 1,394 | 29.52% | 1,934 | 40.96% | 4,722 | ||
| Jackson | 6,456 | 78.36% | 1,783 | 21.64% | 4,673 | 56.72% | 8,239 | ||
| Jefferson | 21,001 | 72.33% | 8,034 | 27.67% | 12,967 | 44.66% | 29,035 | ||
| Johnson | 5,044 | 69.89% | 2,173 | 30.11% | 2,871 | 39.78% | 7,217 | ||
| Lafayette | 2,342 | 61.49% | 1,467 | 38.51% | 875 | 22.97% | 3,809 | ||
| Lawrence | 5,167 | 75.08% | 1,708 | 24.82% | 7 | 0.10% | 3,459 | 50.26% | 6,882 |
| Lee | 3,463 | 68.74% | 1,574 | 31.24% | 1 | 0.02% | 1,889 | 37.50% | 5,038 |
| Lincoln | 3,045 | 81.33% | 699 | 18.67% | 2,346 | 62.66% | 3,744 | ||
| Little River | 3,142 | 68.71% | 1,431 | 31.29% | 1,711 | 37.42% | 4,573 | ||
| Logan | 5,313 | 64.06% | 2,909 | 35.07% | 72 | 0.87% | 2,404 | 28.98% | 8,294 |
| Lonoke | 7,761 | 75.36% | 2,522 | 24.49% | 16 | 0.16% | 5,239 | 50.87% | 10,299 |
| Madison | 2,926 | 53.91% | 2,502 | 46.09% | 424 | 7.81% | 5,428 | ||
| Marion | 2,979 | 59.30% | 2,045 | 40.70% | 934 | 18.59% | 5,024 | ||
| Miller | 6,648 | 58.58% | 4,679 | 41.23% | 22 | 0.19% | 1,969 | 17.35% | 11,349 |
| Mississippi | 10,292 | 63.03% | 6,009 | 36.80% | 27 | 0.17% | 4,283 | 26.23% | 16,328 |
| Monroe | 3,556 | 73.35% | 1,285 | 26.51% | 7 | 0.14% | 2,271 | 46.84% | 4,848 |
| Montgomery | 2,420 | 72.37% | 924 | 27.63% | 1,496 | 44.74% | 3,344 | ||
| Nevada | 3,101 | 72.64% | 1,163 | 27.24% | 5 | 0.12% | 1,938 | 45.40% | 4,269 |
| Newton | 1,840 | 53.32% | 1,611 | 46.68% | 229 | 6.64% | 3,451 | ||
| Ouachita | 8,946 | 76.47% | 2,753 | 23.53% | 6,193 | 52.94% | 11,699 | ||
| Perry | 2,310 | 73.52% | 832 | 26.48% | 1,478 | 47.04% | 3,142 | ||
| Phillips | 7,774 | 69.93% | 3,342 | 30.06% | 1 | 0.01% | 4,432 | 39.87% | 11,117 |
| Pike | 2,822 | 69.40% | 1,234 | 30.35% | 10 | 0.25% | 1,588 | 39.06% | 4,066 |
| Poinsett | 6,835 | 71.45% | 2,726 | 28.50% | 5 | 0.05% | 4,109 | 42.95% | 9,566 |
| Polk | 3,505 | 58.75% | 2,432 | 40.76% | 29 | 0.49% | 1,073 | 17.99% | 5,966 |
| Pope | 8,355 | 65.62% | 4,348 | 34.15% | 29 | 0.23% | 4,007 | 31.47% | 12,732 |
| Prairie | 2,836 | 77.72% | 813 | 22.28% | 2,023 | 55.44% | 3,649 | ||
| Pulaski | 63,541 | 62.62% | 37,690 | 37.14% | 244 | 0.24% | 25,851 | 25.48% | 101,475 |
| Randolph | 4,551 | 74.34% | 1,571 | 25.66% | 2,980 | 48.68% | 6,122 | ||
| St. Francis | 6,851 | 65.12% | 3,639 | 34.59% | 30 | 0.29% | 3,212 | 30.53% | 10,520 |
| Saline | 12,008 | 74.41% | 4,123 | 25.55% | 7 | 0.04% | 7,885 | 48.86% | 16,138 |
| Scott | 2,880 | 66.79% | 1,427 | 33.09% | 5 | 0.12% | 1,453 | 33.70% | 4,312 |
| Searcy | 3,180 | 54.09% | 2,699 | 45.91% | 481 | 8.18% | 5,879 | ||
| Sebastian | 15,768 | 47.11% | 17,671 | 52.79% | 34 | 0.10% | -1,903 | -5.69% | 33,473 |
| Sevier | 3,391 | 69.53% | 1,468 | 30.10% | 18 | 0.37% | 1,923 | 39.43% | 4,877 |
| Sharp | 3,532 | 62.15% | 2,151 | 37.85% | 1,381 | 24.30% | 5,683 | ||
| Stone | 2,718 | 72.54% | 1,014 | 27.06% | 15 | 0.40% | 1,704 | 45.48% | 3,747 |
| Union | 8,257 | 51.03% | 7,918 | 48.93% | 7 | 0.04% | 339 | 2.09% | 16,182 |
| Van Buren | 4,004 | 71.14% | 1,624 | 28.86% | 2,380 | 42.29% | 5,628 | ||
| Washington | 15,610 | 52.32% | 14,132 | 47.37% | 92 | 0.31% | 1,478 | 4.95% | 29,834 |
| White | 11,412 | 70.58% | 4,756 | 29.42% | 6,656 | 41.17% | 16,168 | ||
| Woodruff | 3,040 | 78.09% | 848 | 21.78% | 5 | 0.13% | 2,192 | 56.31% | 3,893 |
| Yell | 5,785 | 74.96% | 1,932 | 25.04% | 3,853 | 49.93% | 7,717 | ||
| Totals | 499,614 | 64.94% | 268,753 | 34.93% | 1,029 | 0.13% | 230,861 | 30.01% | 769,396 |
See also
References
- 1 2 Dave Leip’s U.S. Election Atlas; 1976 Presidential General Election Results – Arkansas
- ↑ Black & Black 1992, p. 295.
- ↑ Black & Black 1992, p. 335.
- ↑ Sullivan, Robert David; ‘How the Red and Blue Map Evolved Over the Past Century’; America Magazine in The National Catholic Review; June 29, 2016
Works cited
- Black, Earl; Black, Merle (1992). The Vital South: How Presidents Are Elected. Harvard University Press. ISBN 0674941306.